If you are in Australia, that is.
Sometime last year I went looking for a decent Internet radio station, as I'm often online on my laptop, but not ofter near radios or reliable reception. I found Star 101.3 FM, and it was good. It happens to be based in the US.
My day would often begin with info bytes from John Tesh followed by hours of music (ok, sometimes they play the same music ;-). When I'd hear "Don Bleu in the morning", I'd know I'd stayed up a bit too late!
Recently Star 101.3 pulled the plug for international listeners "due to licensing restrictions". Ok, I can understand that may well be the case, and I'm glad it lasted as long as it did. If you are in the US you can still listen.
13 August, 2006
Brendan Clones #2
Several months ago several of the Brendan clones were photographed while working on the DTraceToolkit.
More recently they were photographed again, this time working on Solaris Internals and Solaris Performance and Tools. For the first time all of the Brendan clones were involved on the one project, with most of them pictured here. Click for a larger photo:
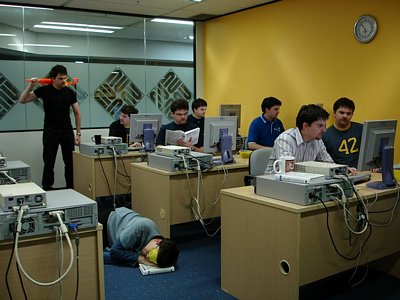
Sleeping Brendan is busy sleeping, Engineer Brendan is studying Solaris Internals 1st edition, and Master Brendan is looking on. The remaining Brendans are meticulously checking facts, reading source code, writing DTrace scripts and testing them.
Of course, photographer Brendan is behind the camera, taking the photo.
11 August, 2006
How much CPU does a down interface chew?
While teaching a DTrace class in Sydney this week I ran an ad-lib demo that took a mysterous and suprising turn. I think you'll find this quite interesting.
One of my favourite DTrace demos begins by asking how much CPU a busy network interface will consume. About 2 in 10 people will know the answer - a lot! But how did you measure this on older Solaris? After all, if it really is "a lot", then we really want a value! 20% of a CPU? 50%?
I was demonstrating on an Ultra 10, with a 333 MHz CPU and a 100 Mbit/sec interface (hme0). Even with the numerous TCP/IP performance enhancements in Solaris 10, driving 100 Mbit/sec on an Ultra 10 will still hurt.
From another host, I sent a large file over the network to drive the interface at capacity. I thought I'd start by showing how busy the network interface was by using the sysperfstat tool from the K9Toolkit (I usually use nicstat, I thought this would be a nice change). sysperfstat ran for a few seconds, then I began the bulk network transfer:
Oh dear! I was expecting %Net to reach around 90%, not over 170%!
Both the Net and Disk percentages are in terms of a single interface or disk, as from experience this has shown to be more useful than a global percentage (which CPU and Mem use). 170% could indicate that I have two network interfaces running at around 85%. But why? I had only initiated one network transfer to the hme0 address.
... The system had become so heavily loaded that sysperfstat's interval of 1 second became 2 and sometimes 3 seconds. Good thing I never assumed sleep(1) would actually sleep for 1 second only - sysperfstat uses delta times from kstat measurements.
Demonstrations are much more exciting when even you don't know of the outcome. So why did we hit 170% utilisation? Maybe another network interface was doing traffic that I didn't know about:
No answers there.
Woah - this "down"
I had began this demo to show %CPU for busy interfaces, which leads us to run the the DTrace based "intrstat" tool - new to Solaris 10. This shows us how much CPU our network interface interrupts are consuming, and now I had a renewed interest in what it had to say:
hme0 is consuming 33% of CPU0, quite a substantial amount - considering this is just a 100 Mbit/sec interface. That's where the planned demo would have ended.
However qfe0 is consuming 37.8% of CPU0 - this is really frightening! Remember, I am sending traffic to hme0's address, and qfe0 is not marked "UP". This is a dead interface with a dummy address - and it is consuming a LOT of CPU! (perhaps it is talking to other dead interfaces? ;-)
I began thinking outside the box, and Scott was around to help. We found that the room was connected to a hub, both hme0 and qfe0 were connected to this same hub, and they both had the same ethernet address. So while qfe0 eventually rejected the packets that it could see, it had to walk through much kernel code to get to that point - consuming CPU cycles and incrementing kstats. (a clue from the nicstat output was that qfe0 was receiving but not sending - so it wasn't taking part in a connection).
I unplugged qfe0 and the problem vanished. Easy. However associating CPU load with a down interface is far from easy!
...
As an aside, I also ask how we measure how utilised the network interfaces are. Very few people have been able to answer this - and it is a topic I hope chapter 7 of this book will increase awareness for. (eg, nicstat or sysperfstat from the K9Toolkit).
One of my favourite DTrace demos begins by asking how much CPU a busy network interface will consume. About 2 in 10 people will know the answer - a lot! But how did you measure this on older Solaris? After all, if it really is "a lot", then we really want a value! 20% of a CPU? 50%?
I was demonstrating on an Ultra 10, with a 333 MHz CPU and a 100 Mbit/sec interface (hme0). Even with the numerous TCP/IP performance enhancements in Solaris 10, driving 100 Mbit/sec on an Ultra 10 will still hurt.
From another host, I sent a large file over the network to drive the interface at capacity. I thought I'd start by showing how busy the network interface was by using the sysperfstat tool from the K9Toolkit (I usually use nicstat, I thought this would be a nice change). sysperfstat ran for a few seconds, then I began the bulk network transfer:
$ /brendan/K9Toolkit/sysperfstat 1
    Time    %CPU   %Mem  %Disk   %Net     CPU    Mem   Disk    Net
19:24:27    5.24  33.52   0.52   0.07    0.05   0.00   0.01   0.00
19:24:28    7.35  33.53   1.29   0.00    0.00   0.00   0.00   0.00
19:24:29    7.48  33.53   0.00   0.00    0.00   0.00   0.00   0.00
19:24:30   39.65  33.79   1.27  51.27    3.69   0.00   0.00   0.00
19:24:32   65.67  33.79   0.00 173.14    1.28   0.00   0.00   0.00
19:24:34   68.35  33.79   0.00 173.03    0.00   0.00   0.00   0.00
19:24:37   80.12  33.79   0.00 176.33    0.82   0.00   0.00   0.00
19:24:39   76.97  33.79   0.00 178.12    0.43   0.00   0.00   0.00
19:24:41   76.08  33.79   1.61 164.82    1.37   0.00   0.00   0.00
19:24:44   80.18  33.79   0.00 177.68    0.38   0.00   0.00   0.00
Oh dear! I was expecting %Net to reach around 90%, not over 170%!
Both the Net and Disk percentages are in terms of a single interface or disk, as from experience this has shown to be more useful than a global percentage (which CPU and Mem use). 170% could indicate that I have two network interfaces running at around 85%. But why? I had only initiated one network transfer to the hme0 address.
... The system had become so heavily loaded that sysperfstat's interval of 1 second became 2 and sometimes 3 seconds. Good thing I never assumed sleep(1) would actually sleep for 1 second only - sysperfstat uses delta times from kstat measurements.
Demonstrations are much more exciting when even you don't know of the outcome. So why did we hit 170% utilisation? Maybe another network interface was doing traffic that I didn't know about:
# ifconfig -a
lo0: flags=2001000849<UP,LOOPBACK,RUNNING,MULTICAST,IPv4,VIRTUAL> mtu 8232 index 1
        inet 127.0.0.1 netmask ff000000
hme0: flags=1000863<UP,BROADCAST,NOTRAILERS,RUNNING,MULTICAST,IPv4> mtu 1500 index 2
        inet 192.168.1.13 netmask ffffff00 broadcast 192.168.1.255
        ether 8:0:20:b0:7a:18
qfe0: flags=1000862<BROADCAST,NOTRAILERS,RUNNING,MULTICAST,IPv4> mtu 1500 index 3
        inet 10.1.2.3 netmask ff000000 broadcast 10.255.255.255
        ether 8:0:20:b0:7a:18
#
No answers there.
hme0 is "UP", qfe0 is both down and has an address class that we aren't using anywhere at this site. So qfe0 can't be doing anything, right?$ /brendan/K9Toolkit/nicstat 1
Time Int rKb/s wKb/s rPk/s wPk/s rAvs wAvs %Util Sat
19:25:34 qfe0 3.77 0.00 2.98 0.00 1292.8 42.00 0.03 0.00
19:25:34 hme0 4.69 0.42 3.77 5.92 1272.9 72.52 0.04 0.00
Time Int rKb/s wKb/s rPk/s wPk/s rAvs wAvs %Util Sat
19:25:36 qfe0 10435.6 0.00 8642.5 0.00 1236.4 0.00 85.49 0.00
19:25:36 hme0 10394.1 818.6 8601.4 15524.7 1237.4 54.00 91.86 0.00
Time Int rKb/s wKb/s rPk/s wPk/s rAvs wAvs %Util Sat
19:25:39 qfe0 10469.2 0.00 8744.1 0.00 1226.0 0.00 85.76 0.00
19:25:39 hme0 10451.4 828.3 8732.5 15708.5 1225.5 54.00 92.40 0.00
Woah - this "down"
qfe0 with a dummy address is 85% busy - somthing really strange is going on! I had began this demo to show %CPU for busy interfaces, which leads us to run the the DTrace based "intrstat" tool - new to Solaris 10. This shows us how much CPU our network interface interrupts are consuming, and now I had a renewed interest in what it had to say:
# intrstat 1

      device |      cpu0 %tim
-------------+---------------
       hme#0 |      1232 32.8
       m64#0 |         0  0.0
       qfe#0 |      1140 37.8
        su#0 |         0  0.0
        su#1 |         0  0.0
      uata#0 |         0  0.0

      device |      cpu0 %tim
-------------+---------------
       hme#0 |      1233 32.9
       m64#0 |         0  0.0
       qfe#0 |      1138 37.8
        su#0 |         0  0.0
        su#1 |         0  0.0
      uata#0 |         1  0.0
...
hme0 is consuming 33% of CPU0, quite a substantial amount - considering this is just a 100 Mbit/sec interface. That's where the planned demo would have ended.
However qfe0 is consuming 37.8% of CPU0 - this is really frightening! Remember, I am sending traffic to hme0's address, and qfe0 is not marked "UP". This is a dead interface with a dummy address - and it is consuming a LOT of CPU! (perhaps it is talking to other dead interfaces? ;-)
I began thinking outside the box, and Scott was around to help. We found that the room was connected to a hub, both hme0 and qfe0 were connected to this same hub, and they both had the same ethernet address. So while qfe0 eventually rejected the packets that it could see, it had to walk through much kernel code to get to that point - consuming CPU cycles and incrementing kstats. (a clue from the nicstat output was that qfe0 was receiving but not sending - so it wasn't taking part in a connection).
I unplugged qfe0 and the problem vanished. Easy. However associating CPU load with a down interface is far from easy!
...
As an aside, I also ask how we measure how utilised the network interfaces are. Very few people have been able to answer this - and it is a topic I hope chapter 7 of this book will increase awareness for. (eg, nicstat or sysperfstat from the K9Toolkit).
08 August, 2006
Solaris Performance and Tools
Both Solaris Internals 2nd Edition and Solaris Performance and Tools are available to purchase, and copies have now began arriving around the World. They are both incredible books, covering an enormous range of topics with details not found anywhere else.
During my years working in the field of performance, I've taught numerous performance classes for Sun Microsystems where I gained both the experience and understanding of how to best teach performance. I have also written numerous open source programs for performance monitoring, such as tools in the DTraceToolkit and the K9Toolkit. It was a privilege to share the best of my performance knowledge and teaching experience by co-authoring Solaris Performance and Tools with Richard and Jim. We were fortunate to have many other subject matter experts also contribute to this book, including Mike Shapiro and Jon Haslam.
For Solaris Performance and Tools, it is exciting to see a book that covers both DTrace and mdb in detail, with practical examples. And Solaris Internals 2nd Edition is fascinating for understanding the kernel, with the numerous Solaris 10 enhancements. I hope people enjoy them both.
 |  |
During my years working in the field of performance, I've taught numerous performance classes for Sun Microsystems where I gained both the experience and understanding of how to best teach performance. I have also written numerous open source programs for performance monitoring, such as tools in the DTraceToolkit and the K9Toolkit. It was a privilege to share the best of my performance knowledge and teaching experience by co-authoring Solaris Performance and Tools with Richard and Jim. We were fortunate to have many other subject matter experts also contribute to this book, including Mike Shapiro and Jon Haslam.
For Solaris Performance and Tools, it is exciting to see a book that covers both DTrace and mdb in detail, with practical examples. And Solaris Internals 2nd Edition is fascinating for understanding the kernel, with the numerous Solaris 10 enhancements. I hope people enjoy them both.
Subscribe to:
Comments (Atom)