14 December, 2006

Updates from California

Since I've been quiet for a while on this blog and on OpenSolaris mailing lists, here is a quick update about myself and my projects.

I got married, ditched my old car, left the instructing/consulting scene in Australia/APAC, and moved to California to work as a developer at Sun. I brought along whatever I could fit in airline luggage, which included a laptop, hard disks, some books, clothes, and my fencing gear. Since then, I've been busy getting up to speed with some interesting projects, some of which I've discussed on my Sun blog.

OpenSolaris projects such as the DTraceToolkit will remain OpenSolaris projects; and other open source projects such as Chaosreader will of course remain open source. I'll post updates about them to this blog and will continue working on them as I always have done - as a spare time hobby.

Progress on these other projects has been on hold since I left Australia and powered down my array of test and development servers (and sadly powered down "mars", my main server which had an uptime of over 400 days). I began rebuilding my development environment last night, when I powered on the disk containing the DTraceToolkit build files for the first time in three months. I'm looking forward to adding some more scripts, and more documentation to guide people through the toolkit.

And finally, living in the US has been great - however the following items were quite difficult to find:
  1. cricket coverage
  2. authentic ginger beer
I can now listen to Star 101.3 again, but I've lost access to both the ABC and BBC's online radio coverage of the Ashes Cricket series - which seems to be blocked from the US!

13 August, 2006

No more Star 101.3

If you are in Australia, that is.

Sometime last year I went looking for a decent Internet radio station, as I'm often online on my laptop, but not ofter near radios or reliable reception. I found Star 101.3 FM, and it was good. It happens to be based in the US.

My day would often begin with info bytes from John Tesh followed by hours of music (ok, sometimes they play the same music ;-). When I'd hear "Don Bleu in the morning", I'd know I'd stayed up a bit too late!

Recently Star 101.3 pulled the plug for international listeners "due to licensing restrictions". Ok, I can understand that may well be the case, and I'm glad it lasted as long as it did. If you are in the US you can still listen.

Brendan Clones #2

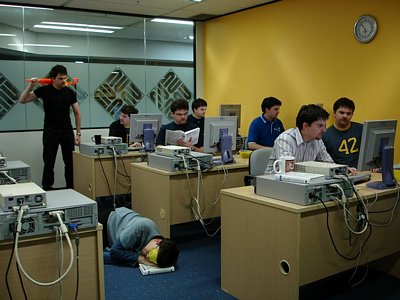
Several months ago several of the Brendan clones were photographed while working on the DTraceToolkit.

More recently they were photographed again, this time working on Solaris Internals and Solaris Performance and Tools. For the first time all of the Brendan clones were involved on the one project, with most of them pictured here. Click for a larger photo:


Sleeping Brendan is busy sleeping, Engineer Brendan is studying Solaris Internals 1st edition, and Master Brendan is looking on. The remaining Brendans are meticulously checking facts, reading source code, writing DTrace scripts and testing them.

Of course, photographer Brendan is behind the camera, taking the photo.

11 August, 2006

How much CPU does a down interface chew?

While teaching a DTrace class in Sydney this week I ran an ad-lib demo that took a mysterous and suprising turn. I think you'll find this quite interesting.

One of my favourite DTrace demos begins by asking how much CPU a busy network interface will consume. About 2 in 10 people will know the answer - a lot! But how did you measure this on older Solaris? After all, if it really is "a lot", then we really want a value! 20% of a CPU? 50%?

I was demonstrating on an Ultra 10, with a 333 MHz CPU and a 100 Mbit/sec interface (hme0). Even with the numerous TCP/IP performance enhancements in Solaris 10, driving 100 Mbit/sec on an Ultra 10 will still hurt.

From another host, I sent a large file over the network to drive the interface at capacity. I thought I'd start by showing how busy the network interface was by using the sysperfstat tool from the K9Toolkit (I usually use nicstat, I thought this would be a nice change). sysperfstat ran for a few seconds, then I began the bulk network transfer:
$ /brendan/K9Toolkit/sysperfstat 1
Time %CPU %Mem %Disk %Net CPU Mem Disk Net
19:24:27 5.24 33.52 0.52 0.07 0.05 0.00 0.01 0.00
19:24:28 7.35 33.53 1.29 0.00 0.00 0.00 0.00 0.00
19:24:29 7.48 33.53 0.00 0.00 0.00 0.00 0.00 0.00
19:24:30 39.65 33.79 1.27 51.27 3.69 0.00 0.00 0.00
19:24:32 65.67 33.79 0.00 173.14 1.28 0.00 0.00 0.00
19:24:34 68.35 33.79 0.00 173.03 0.00 0.00 0.00 0.00
19:24:37 80.12 33.79 0.00 176.33 0.82 0.00 0.00 0.00
19:24:39 76.97 33.79 0.00 178.12 0.43 0.00 0.00 0.00
19:24:41 76.08 33.79 1.61 164.82 1.37 0.00 0.00 0.00
19:24:44 80.18 33.79 0.00 177.68 0.38 0.00 0.00 0.00

Oh dear! I was expecting %Net to reach around 90%, not over 170%!

Both the Net and Disk percentages are in terms of a single interface or disk, as from experience this has shown to be more useful than a global percentage (which CPU and Mem use). 170% could indicate that I have two network interfaces running at around 85%. But why? I had only initiated one network transfer to the hme0 address.

... The system had become so heavily loaded that sysperfstat's interval of 1 second became 2 and sometimes 3 seconds. Good thing I never assumed sleep(1) would actually sleep for 1 second only - sysperfstat uses delta times from kstat measurements.

Demonstrations are much more exciting when even you don't know of the outcome. So why did we hit 170% utilisation? Maybe another network interface was doing traffic that I didn't know about:
# ifconfig -a
lo0: flags=2001000849<UP,LOOPBACK,RUNNING,MULTICAST,IPv4,VIRTUAL> mtu 8232 index 1
inet 127.0.0.1 netmask ff000000
hme0: flags=1000863<UP,BROADCAST,NOTRAILERS,RUNNING,MULTICAST,IPv4> mtu 1500 index 2
inet 192.168.1.13 netmask ffffff00 broadcast 192.168.1.255
ether 8:0:20:b0:7a:18
qfe0: flags=1000862<BROADCAST,NOTRAILERS,RUNNING,MULTICAST,IPv4> mtu 1500 index 3
inet 10.1.2.3 netmask ff000000 broadcast 10.255.255.255
ether 8:0:20:b0:7a:18
#

No answers there. hme0 is "UP", qfe0 is both down and has an address class that we aren't using anywhere at this site. So qfe0 can't be doing anything, right?
$ /brendan/K9Toolkit/nicstat 1
Time Int rKb/s wKb/s rPk/s wPk/s rAvs wAvs %Util Sat
19:25:34 qfe0 3.77 0.00 2.98 0.00 1292.8 42.00 0.03 0.00
19:25:34 hme0 4.69 0.42 3.77 5.92 1272.9 72.52 0.04 0.00
Time Int rKb/s wKb/s rPk/s wPk/s rAvs wAvs %Util Sat
19:25:36 qfe0 10435.6 0.00 8642.5 0.00 1236.4 0.00 85.49 0.00
19:25:36 hme0 10394.1 818.6 8601.4 15524.7 1237.4 54.00 91.86 0.00
Time Int rKb/s wKb/s rPk/s wPk/s rAvs wAvs %Util Sat
19:25:39 qfe0 10469.2 0.00 8744.1 0.00 1226.0 0.00 85.76 0.00
19:25:39 hme0 10451.4 828.3 8732.5 15708.5 1225.5 54.00 92.40 0.00

Woah - this "down" qfe0 with a dummy address is 85% busy - somthing really strange is going on!

I had began this demo to show %CPU for busy interfaces, which leads us to run the the DTrace based "intrstat" tool - new to Solaris 10. This shows us how much CPU our network interface interrupts are consuming, and now I had a renewed interest in what it had to say:
# intrstat 1

device | cpu0 %tim
-------------+---------------
hme#0 | 1232 32.8
m64#0 | 0 0.0
qfe#0 | 1140 37.8
su#0 | 0 0.0
su#1 | 0 0.0
uata#0 | 0 0.0

device | cpu0 %tim
-------------+---------------
hme#0 | 1233 32.9
m64#0 | 0 0.0
qfe#0 | 1138 37.8
su#0 | 0 0.0
su#1 | 0 0.0
uata#0 | 1 0.0
...

hme0 is consuming 33% of CPU0, quite a substantial amount - considering this is just a 100 Mbit/sec interface. That's where the planned demo would have ended.

However qfe0 is consuming 37.8% of CPU0 - this is really frightening! Remember, I am sending traffic to hme0's address, and qfe0 is not marked "UP". This is a dead interface with a dummy address - and it is consuming a LOT of CPU! (perhaps it is talking to other dead interfaces? ;-)

I began thinking outside the box, and Scott was around to help. We found that the room was connected to a hub, both hme0 and qfe0 were connected to this same hub, and they both had the same ethernet address. So while qfe0 eventually rejected the packets that it could see, it had to walk through much kernel code to get to that point - consuming CPU cycles and incrementing kstats. (a clue from the nicstat output was that qfe0 was receiving but not sending - so it wasn't taking part in a connection).

I unplugged qfe0 and the problem vanished. Easy. However associating CPU load with a down interface is far from easy!

...

As an aside, I also ask how we measure how utilised the network interfaces are. Very few people have been able to answer this - and it is a topic I hope chapter 7 of this book will increase awareness for. (eg, nicstat or sysperfstat from the K9Toolkit).
08 August, 2006

Solaris Performance and Tools

Both Solaris Internals 2nd Edition and Solaris Performance and Tools are available to purchase, and copies have now began arriving around the World. They are both incredible books, covering an enormous range of topics with details not found anywhere else.


During my years working in the field of performance, I've taught numerous performance classes for Sun Microsystems where I gained both the experience and understanding of how to best teach performance. I have also written numerous open source programs for performance monitoring, such as tools in the DTraceToolkit and the K9Toolkit. It was a privilege to share the best of my performance knowledge and teaching experience by co-authoring Solaris Performance and Tools with Richard and Jim. We were fortunate to have many other subject matter experts also contribute to this book, including Mike Shapiro and Jon Haslam.

For Solaris Performance and Tools, it is exciting to see a book that covers both DTrace and mdb in detail, with practical examples. And Solaris Internals 2nd Edition is fascinating for understanding the kernel, with the numerous Solaris 10 enhancements. I hope people enjoy them both.

23 July, 2006

Solaris Internals 2nd Edition - available!

Great news! Solaris Internals 2nd Edition is now available to purchase from sites such as Amazon. Amazon writes "Availability: Usually ships within 24 hours" - so in less than a day (I imagine a business day, if you are in the US), you could be holding this landmark book.

I've studied this edition from cover to cover, and it is incredible to see such a wide range of topics covered well, and at such a unique depth. It is the reference for the Solaris 10 and OpenSolaris kernel, and is written in an endearing way that makes this enormous topic very approachable.

I can't wait to get my hard copy of this book. I really enjoyed studying the content the first time, and I'll really enjoy revisiting the chapters.

18 July, 2006

DTrace Slides

The slides I used for the recent DTrace Workshop in London have been put online by Context-Switch. This DTrace presentation covers my own method of teaching DTrace, which begins with a summary of performance monitoring tools in Solaris 9 and their limitations.

The slides also document many of the strategies I use for DTrace analysis, and is the first time they have been listed together online. They are,

DTrace Strategies
  1. Snoop or Summary

  2. Drill Down Analysis

  3. Frequency Count

  4. Known Count

  5. Aggregate Stacks

  6. Elapsed Time

  7. On-CPU Time

  8. Milestones

See chapters 5 and 10 from the slides for details.

The slides are used in conjunction with additional live demonstrations and student labs. They also assume that the almost released book, Solaris Performance and Tools can be used as a reference.

27 June, 2006

Offline

I've been mostly offline for a few weeks, and this will continue for a few more. I'm in the middle of at 6 weeks of travel (London, London, Perth, Canberra, Melbourne, Tokyo, ...?), much of which is spent at hotels without Internet access or at airports (and all of it without access to my DTrace development servers at home, in Sydney).

By a stroke of luck I am actually in Sydney on the 6th of July (inbetween flights), and should be at the next meeting for SOSUG.

31 May, 2006

DTraceTazTool - alpha release

Several years ago, Richard McDougall wrote taztool - a GUI to display disk activity in an amazing and intuitive way. It used TNF trace data - a predecessor of DTrace.

In Janurary 2006 I began writing a DTrace version of taztool: DTraceTazTool. I wrote it using GTK and DTrace. Since then, the DTrace JNI has been released, and I've paused developing DTraceTazTool until I've taken a long look at Java 1.5. Until then, I'm releasing where I am at with the GTK/C version, on my DTrace website.

This is an alpha release - I'm still adding functionality, working through a todo list and fixing bugs. I'm releasing it early as it is already somewhat useful, and a great demo of DTrace. Probably the next feature I'll add is the ability to trace an entire disk at a time (rather than per-slice).

The following screenshot shows a UFS file system that was archived using the tar command. For the top plot: the requested block location is on the Y-axis, time is the X-axis, and the colour reflects the number of requests for that location (many == red). The bottom plot shows maximum and average seek distance.


DTraceTazTool already has some tunable options, such as the size of the pixels drawn and the sample rate,


DTraceTazTool needs to either run as root, or as a user with the dtrace_kernel privilege.

I hope you enjoy the tool so far. I'll post about updates as I complete them.

28 May, 2006

Book Updates

Jim did post an entry about Solaris Internals 2nd edition and Sun Performance and Tuning. We are all now eagerly awaiting the publication of these books.

An article about these books was posted on sunflash.sun.com (login required), a website of Sun events.

And some updates were made to the Prentice Hall website for these books (Solaris Internals 2nd edition, Sun Performance and Tools).
DTracing Scheduling Classes

I've recently been working on some new killer DTrace scripts, and the DTrace UK Workshops. I thought I'd take a break and share something interesting.

The following is from the DTraceToolkit, and is one of my favourite tool example files (Docs/Examples/priclass_example.txt). I'm a firm believer in providing examples, and plan to enhance the existing examples in the toolkit further. There also seems to be a trend to include more examples in Solaris man pages (such as zfs and zpool), which is great to see.


The following is a demonstration of the priclass.d script.

The script was run for several seconds then Ctrl-C was hit. During this time, other processes in different scheduling classes were running.
# ./priclass.d
Sampling... Hit Ctrl-C to end.
^C

IA
value ------------- Distribution ------------- count
40 | 0
50 |@@@@@@@@@@@@@@@@@@@@@@@@@@@@@@@@@@@@@@@@ 30
60 | 0

SYS
value ------------- Distribution ------------- count
< 0 |@@@@@@@@@@@@@@@@@@@@@@@@@@@@@@@@@@@@@@@ 4959
0 | 0
10 | 0
20 | 0
30 | 0
40 | 0
50 | 0
60 | 30
70 | 0
80 | 0
90 | 0
100 | 0
110 | 0
120 | 0
130 | 0
140 | 0
150 | 0
160 | 50
>= 170 | 0

RT
value ------------- Distribution ------------- count
90 | 0
100 |@@@@@@@@@@@@@@@@@@@@@@@@@@@@@@@@@@@@@@@@ 110
110 | 0

TS
value ------------- Distribution ------------- count
< 0 | 0
0 |@@@@@@@@@@@@@@@ 2880
10 |@@@@@@@ 1280
20 |@@@@@ 990
30 |@@@@@ 920
40 |@@@@ 670
50 |@@@@ 730
60 | 0

The output is quite interesting, and illustrates neatly the behaviour of different scheduling classes.

The IA interactive class had 30 samples of a 50 to 59 priority, a fairly high priority. This class is used for interactive processes, such as the windowing system. I had clicked on a few windows to create this activity.

The SYS system class has had 4959 samples at a < 0 priority - the lowest, which was for the idle thread. There are a few samples at higher priorities, including some in the 160 to 169 range (the highest), which are for interrupt threads. The system class is used by the kernel.

The RT real time class had 110 samples in the 100 to 109 priority range. This class is designed for real-time applications, those that must have a consistant response time regardless of other process activity. For that reason, the RT class trumps both TS and IA. I created these events by running "prstat -R" as root, which runs prstat in the real time class.

The TS time sharing class is the default scheduling class for the processes on a Solaris system. I ran an infinite shell loop to create heavy activity, "while :; do :; done", which shows a profile that leans towards lower priorities. This is deliberate behaivour from the time sharing class, which reduces the priority of CPU bound processes so that they interefere less with I/O bound processes. The result is more samples in the lower priority ranges.

08 May, 2006

Ged - GUI-ed

I've just uploaded Ged to the Specials collection - it is a GUI front-end to the "ed" line editor, and has been written for Java 1.5 using Swing. It enhances "ed" in several ways, such as providing optional themes, sound effects, and a stunning splash screen rendered in POV-ray.[1]


ok, the real reason I'm coding in Java/Swing is to test drive the new Java 1.5 features and the Swing API. I've coded in Java before, however the last few years I've been using mostly Shell, Perl, C and DTrace. There are some really great features in Java 1.5 to try out. I'm also planning on writing some more freeware GUI-based programs; such as performance monitoring tools (DTrace) and Games.

In the past I've coded in OSF/Motif, GTK 2.0, Java/AWT and now Java/Swing. It's hard to choose a single winner - they each have different pros and cons; however I do like coding in both GTK and Swing.

For now, enjoy Ged. No, I didn't write "ed" itself in Java - it borrows /bin/ed. Of course - I could write "ed" entirerly in Java, which would make Ged more portable, but there are higher things on my todo list!

[1] which was then mutilated by downsampling to "classic" 2-bit colour.

25 April, 2006

Learn DTrace @ London

During the past five years I've delivered many training events across Australia and Asia; however this will be my first event in Europe.

I will be delivering two 3-day classes near the London area (Egham), from June 7th-9th and June 12th-14th, 2006. The website is here, and seats are currently available (but won't be forever).

These are special classes that will cover not only DTrace, but most importantly the "DTrace Mentality" - strategies used to tackle problems, and a workshop of mystery problems to practice on. I'll also discuss the DTraceToolkit and other performance tools.

There are currently no plans to run these classes again, so as far as I know - this is it.

I'm really looking forward to these events. And beforehand, please think of what problems have stumped you in the past on Solaris - especially statistics that you were unable to measure, so that you can ask me in person. If I can't answer it, I'll try to write the script that can. And if the script is useful, it may end up in the DTraceToolkit!
DTraceToolkit ver 0.96

I've just uploaded the latest build of DTraceToolkit, which now contains 104 scripts!

12 scripts have been added and 46 scripts were updated - this is a BIG revision. Since there have been so many new changes, I'm holding the version number below 1.00 until the dust has settled (I was keeping version number equal to the script count, however I'll hold back on that for a while).

This is the first rev to include a few scripts written by other people - Richard McDougall and Jonathan Adams, who can both write DTrace well and more importantly, have an exceptional understanding of subtle kernel nuances.

This rev has had another small style change (which is why so many scripts were updated). I've also began writing a document called the "DTraceToolkit Style Guide", which documents the style and programming best practices used by the scripts in the toolkit. I'll post more about that later.

Stefan Parvu helped out with platform testing, which is crucial. Some of the tcp scripts had began not working on newer builds (since they are fbt based, and fbt is not a stable interface (and not supposed to be)). They have been fixed (for now!).

As usual, check locations such as Docs/Examples for examples of the newly added scripts in action. Enjoy!

19 April, 2006

Tokyo, Japan

A few weeks ago I was in Tokyo to deliver a couple of Solaris 10 events for Sun. It was the time of year for cherry blossoms, and a great time to take photos. I've just added a series of them to the cityscapes on my website.

04 April, 2006

Solaris Internals 2nd Edition

This book (now 2 volumes) has been sent to the publisher!

Jim and Richard have again made a remarkable effort to create a unique and valuable reference. It covers an incredible range of topics, each with useful explinations you won't find anywhere else.

Richard has posted an entry to describe the books, and links to their tables of contents.

I'm very proud to have helped out, including authoring material for the 2nd volume. For many years I've taught Solaris performance classes for Sun, engaged in Solaris performance consulting, and more recently written freeware performance tools - such as the DTraceToolkit. It's been a privilege to share my most useful knowledge in this way.

I have provided scripts inline (listing the source) wherever possible - giving the reader the choice of either using the script, or reading and understanding the script internals - and making their own customisations. We do often discuss such tool internals - which is appropriate for Solaris Internals.

I've also carefully studied both volumes in detail - and it is truly incredible what they cover. This will open the lid on many new topics that have previously not been discussed or exposed. Other engineers and experts have helped out, providing many valuable insights - especially when discussing technology that they themselves created.

I think this has a wider audience than the first edition as we discuss topics closer to home for sysadmins, support staff and developers - such as performance observability and debugging. Check the table of contents for the second volume to see what I mean.

It's now up to the publisher to print out the book. If there is any news on this we can share, we will. Check our blogs (Richard, Jim, and me).

I've been somewhat quiet on the OpenSolaris scene during the last several weeks - this is why! I'm now "back" :)

13 February, 2006

Learn DTrace, visit Sydney

Sun is borrowing me to deliver a 3-day DTrace class in Sydney, starting on the 6th of March (assuming enough students sign up). I love DTrace, and teaching it on behalf of Sun is a great privilege.

Occasionally, Australian IT workers will be lucky enough to visit the US (or elsewhere) to attend unique training classes. Classes that aren't taught anywhere else in the World. While it's no holiday (it can be hard work), it does make for a fantastic break from sitting behind a desk day after day (or sitting in a cold server room).

Please let me return the favour and give you an excuse to visit Sydney, Australia! Where else in the World will you be taught DTrace from the author of the DTraceToolkit?

I have taught DTrace before: be prepared for some really intense training! We usually drink lots of coffee, finish later than usual, and cover a lot more than is in the notes. I encourage students to bring in their work problems and get me to solve them (live, in front of the class!).

Ok, I know many companies may choke at the thought of paying for flights to Australia + hotel + training. But if you do wangle it, then I'll see you on the 6th (and the weather is usually great that time of year. ;)

07 February, 2006

OpenSolaris Games

The OpenSolaris Games community has opened. It exists to list games, provide install instructions, develop new games, and to give us an excuse to play games.

There are tons of games out there that will work on OpenSolaris. These include RougeLike games, such as NetHack, Angband, ZAngband, ToME, etc, and ports of the Doom engine. I've linked to a modest collection on the website, which will gradually grow as others help out.

Please post game URLs to the mailing list, and help out where you can. There are many games and many genres, and to cover them properly on a website will need a lot of help from the OpenSolaris community.

So far, most of the games are hosted on Blastwave - thanks to Dennis and team for making them available.

...

I have actually written games in the past, although they wern't very good games. These include xpong written entirerly in dtksh, and a port of "Hunt the Wumpus" as an mdb loadable module. I'm also helping with other projects to write decent games, including a curses based shoot-em-up written by Boyd; more on that later.

27 January, 2006

checkcable 0.95

checkcable has been updated. It now uses the Perl library Sun::Solaris::Kstat again, where possible. The first version did this for all cards, but the Kstat data wasn't reliable and sadly I had to wrap ndd instead (boring!).

If you haven't seen it before, checkcable produces the following output,
   # checkcable
Interface Link Duplex Speed AutoNEG
hme0 UP FULL 100 ON

It has been written to support dmfe, bge, ce, rtls, ge, hme, and a few others. It occasionally gets updated to support extra cards (see the HISTORY list). Many people have emailed me about this program over the years - thanks for your support. If you do send me updates to the code, please follow the style. These days I'm following "Perl Best Practices" by O'Reilly (yes Mark, you've guilted me into it :-).

In similar news, Alan has been working on bringing Kstat.pm into the OpenSolaris build, which all of my Sun::Solaris::Kstat tools use. Thank you Alan!

11 January, 2006

Brendan Clones

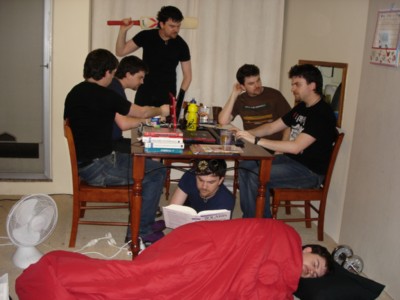
Recently James Dickens figured out that I'm a member of a family of Brendan clones, and suggested that there may be 1000 Brendan clones in Australia. Now that the cat's out of the bag, let me clear up a few things and introduce the gang. Firstly, there isn't 1000 of us - it's more like a dozen, however the number does vary. The following is a photo of 7 Brendan clones busy working.


Sitting on the close left is documentation Brendan, and on the far left is testing Brendan - who is always busy testing programs in a variety of scenarios. Documentation Brendan takes the most interesting tests from testing Brendan and turns them into example documentation. Documentation Brendan also sometimes answers emails when email Brendan is travelling for work (as is the case here).

On the close right is programmer Brendan hard at work typing code. Sitting on the far right is creative Brendan, making suggestions to programmer Brendan. Creative Brendan maintains the enormous todo list for all the Brendan clones.

Sitting under the desk reading is study Brendan, who is currently studying "Solaris Systems Programming" by Rich Teer. Study Brendan is always reading, and reads textbooks from cover to cover. If he isn't careful he may need to get glasses (or borrow them from engineer Brendan, who isn't pictured here).

Sleeping on the floor is sleeping Brendan, who sleeps on behalf of all the Brendan clones.

Standing with the cricket bat is master Brendan, who creates Brendan clones and destroys the ones not working hard enough. Programmer Brendan calls him "homicidal maniac Brendan", and only gets away with it as he works so hard.

Out of shot is TV Brendan, watching the Australia vs South Africa test cricket series. And (of course) photographer Brendan is taking the photo.
DTraceToolkit ver 0.92
I've just uploaded the latest version of the DTraceToolkit. A number of niggling issues have been fixed, and a few scripts added.

The next few releases should be about polishing other components of the toolkit - such as documentation and examples, rather than simply adding more scripts.

I hope you find the toolkit useful.

10 January, 2006

findbill

I just made a quick update to findbill, a simple Perl program that scans a disk to find where backup UFS superblocks are. Most of the time sysadmins use "newfs -N" for this - however if you have tuned file system parameters "newfs -N" doesn't always work.

The output now includes information from the superblocks: last write time and mountpoint, if available. This should help identify what are false positives - such as older superblocks from a previous filesystem that haven't been overwritten.

# findbill /dev/rdsk/c0d0s3
Searching /dev/rdsk/c0d0s3,

Type Block Time last written Mountpoint
UFS 16 Sun Jan 8 16:11:42 2006 /extra1
UFS 32 Sun Apr 17 18:28:54 2005
UFS 32352 Sun Apr 17 18:28:54 2005
UFS 64672 Sun Apr 17 18:28:54 2005
UFS 96992 Sun Apr 17 18:28:54 2005
UFS 129312 Sun Apr 17 18:28:54 2005
UFS 161632 Sun Apr 17 18:28:54 2005
UFS 193952 Sun Apr 17 18:28:54 2005
^C


It's called "findbill" as I've heard the UFS magic number (0x011954, which we scan for) is either Bill Joy's or Marshall Kirk McKusick's birthday (the FFS authors). The UFS cylinder block magic number (0x090255) looks suspicious too.

findbill also identifies superblocks from MTB_UFS - the revamped UFS for the world of terabyte filesystems (UFS lives!).

04 January, 2006

3d Photos

I've uploaded new photos to my website, including some of San Francisco and the Grand Canyon. I've also uploaded a few 3d anaglyphs (red/cyan glasses) taken at Beijing,


I created these anaglyphs using the freeware tool AnaBuilder, and are available in full resolution (downsampling anaglyphs can sometimes cause odd JPEG artifacts). Anaglyphs may give way to autostereo displays in the future (no glasses required), or even VR displays if they ever take of, so keep hold of the original left/right pair. In the meantime anaglyphs are fine.

Hopefully I'll inspire others to try 3d photography. :-)